Drop Formation

Waveform Editor

1D Waveform Sweeps
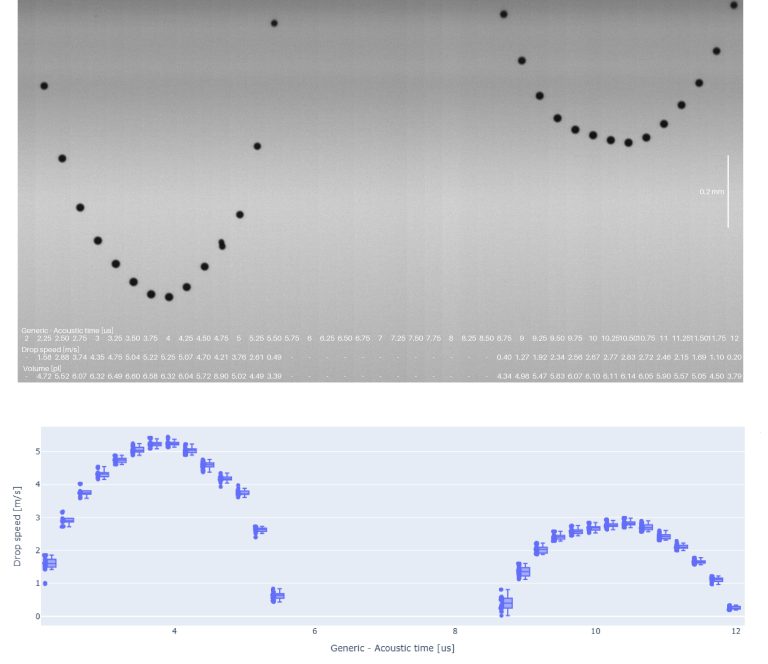
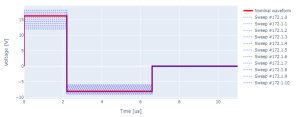
An amplitude sweep is applied to evaluate the effect of voltage scaling on the drop properties. In the attached example, the main satellite stops merging with the main drop when the voltage goes over 80% of the reference voltage.


2D Sweep: Amplitude and Temperature

High-Frequency Optimization


Long-Distance Optimization
Misting Reduction


Nozzle Navigator
Open Nozzle Time
